Image Sampling
Faisal Qureshi
Professor
Faculty of Science
Ontario Tech University
Oshawa ON Canada
http://vclab.science.ontariotechu.ca
Copyright information
© Faisal Qureshi
License

This work is licensed under a Creative Commons Attribution-NonCommercial 4.0 International License.
import numpy as np
import scipy as sp
from scipy import signal
import cv2 as cv
import matplotlib.pyplot as plt
import matplotlib as mpl
from matplotlib import cm
from matplotlib.ticker import LinearLocator, FormatStrFormatter
Lesson Plan
- Interpolation basics
- Image sampling
- Bilinear sampling
Interplation in 1D
# Example from https://docs.scipy.org/doc/scipy/reference/tutorial/interpolate.html

from scipy.interpolate import interp1d

x = np.linspace(0, 10, num=11, endpoint=True)
y = np.cos(-x**2/9.0)

plt.figure(figsize=(10,5))
plt.plot(x, y, 'ro')
plt.xlabel('x')
plt.ylabel('y');
# try kind = 'cubic', 'nearest', 'next', 'previous', 'quadratic'
f = interp1d(x, y, kind='cubic')

xnew = np.linspace(0, 10, num=181, endpoint=True)

plt.figure(figsize=(10,5))
plt.plot(x, y, 'ro', xnew, f(xnew), '-b')
plt.xlabel('x')
plt.ylabel('y');
Sampling in 2D
filename = 'data/van-gogh.jpg'
I = cv.imread(filename)
I = cv.cvtColor(I, cv.COLOR_BGR2RGB)
plt.figure(figsize=(6,6))
plt.xticks([])
plt.yticks([])
plt.title('{}'.format(filename))
plt.imshow(I);
Lets inspect the shape and data type of this image
print('Shape = {}'.format(I.shape))
print('Data type = {}'.format(I.dtype))
Shape = (512, 512, 3)
Data type = uint8
Setting up destination image
Lets setup a destination image
h, w = 32, 32
dst = np.empty((h, w, 3), dtype=I.dtype)
Setting up sampling locations
Now set up sampling coordinates. locs is setup to map $(x,y)$ locations in the source image with corresponding pixel $(i,j)$ locations in the destination image.
y_src = np.linspace(0, I.shape[0], h)
x_src = np.linspace(0, I.shape[1], w)
yy_src, xx_src = np.meshgrid(y_src, x_src)

y_dst = np.arange(0, h)
x_dst = np.arange(0, w)
yy_dst, xx_dst = np.meshgrid(y_dst, x_dst)

locs = zip(yy_src.flatten(), xx_src.flatten(), yy_dst.flatten().astype('uint'), xx_dst.flatten().astype('uint'))
Performing sampling
The following function copies pixel color at location $(x,y)$ in the source image to pixel location $(i,j)$ in the destination image.
def sample(I, dst, locs):
    for (y_src, x_src, y_dst, x_dst) in locs:
        s = (x_src, y_src) # Notice the switch of x and y
        dst[y_dst, x_dst] = cv.getRectSubPix(I, tuple((1,1)), tuple(s))[0,0]
sample(I, dst, locs)
plt.figure(figsize=(5,5))
plt.xticks([])
plt.yticks([])
plt.imshow(dst);
We can also transform source pixel locations $(x,y)$ as needed when performing sampling. The following function transforms source pixel locations $(x,y)$ with a 3-by-3 matrix $M$.
def setup_sampling_locs(I, dst, region=None, M=np.eye(3)):
    h, w = dst.shape[0], dst.shape[1]

    if region == None:
        y_src = np.linspace(0, I.shape[0], h)
        x_src = np.linspace(0, I.shape[1], w)
    else:
        y_src = np.linspace(region[0], region[1], h)
        x_src = np.linspace(region[2], region[3], w)
    yy_src, xx_src = np.meshgrid(y_src, x_src)

    pts_src = np.vstack((xx_src.flatten(), yy_src.flatten(), np.ones(h*w))) # Homogeneous coordinates
    pts_transformed = np.dot(M, pts_src - np.mean(pts_src,1).reshape(3,1)) + np.mean(pts_src, 1).reshape((3,1))
    pts_transformed[0,:] = pts_transformed[0,:] / pts_transformed[2,:] # Homoegeneous divide
    pts_transformed[1,:] = pts_transformed[1,:] / pts_transformed[2,:]

    y_dst = np.arange(0, h)
    x_dst = np.arange(0, w)
    yy_dst, xx_dst = np.meshgrid(y_dst, x_dst)

    return lambda: zip(pts_transformed[1,:], pts_transformed[0,:], yy_dst.flatten().astype('uint'), xx_dst.flatten().astype('uint'))
A little helper function to help visualize the sampled locations in the source image.
def get_cmap(n, name='hsv'):
    '''Returns a function that maps each index
       in 0, 1, ..., n-1 to a distinct RGB color.
       The keyword argument name must be a standard
       mpl colormap name.'''
    return plt.get_cmap(name, n)
Visualizing sampling locations
The following figure illustrates the sampling procdure. Figure on the right is the source image. Sampled locations that make up the pixels of the destination image are overlayed on the source image.
cmap = get_cmap(h*w)
locs = setup_sampling_locs(I, dst)
sample(I, dst, locs())
plt.figure(figsize=(15,7.5))
plt.subplot(121)
plt.xticks([])
plt.yticks([])
plt.imshow(dst)
plt.subplot(122)
plt.xticks([])
plt.yticks([])
plt.imshow(I)
for i, (y_src, x_src, _, _) in enumerate(locs()):
    plt.scatter(x_src, y_src, color=cmap(i))
Sampling over a subregion
We can also specify a subregion in the source image to sample from.
cmap = get_cmap(h*w)
locs = setup_sampling_locs(I, dst, region=[160, 230, 200, 270])
sample(I, dst, locs())
plt.figure(figsize=(15,7.5))
plt.subplot(121)
plt.xticks([])
plt.yticks([])
plt.imshow(dst)
plt.subplot(122)
plt.xticks([])
plt.yticks([])
plt.imshow(I)
for i, (y_src, x_src, _, _) in enumerate(locs()):
    plt.scatter(x_src, y_src, color=cmap(i))
Transforming the sampling locations (rotation, translation, scale)
Lets rotate the sampling locations, and see what we get
$$ R = \left[ \begin{array}{cc} \cos \theta & - \sin \theta \\ \sin \theta & \cos \theta \end{array} \right] $$
Matrix $R$ represent counter-clockwise rotation in the $xy$-plane.
def rot2d(theta_degrees):
    theta = np.pi * theta_degrees / 180.0
    r = np.eye(3)
    r[0][0] = np.cos(theta)
    r[0][1] = - np.sin(theta)
    r[1][0] = np.sin(theta)
    r[1][1] = np.cos(theta)
    return r
Note that our $y$ axis is facing downwards. So the rotation appears to be clockwise, while actually it is counter-clockwise.
cmap = get_cmap(h*w)
locs = setup_sampling_locs(I, dst, region=[160, 230, 200, 270], M=rot2d(45))
sample(I, dst, locs())
plt.figure(figsize=(15,7.5))
plt.subplot(121)
plt.xticks([])
plt.yticks([])
plt.imshow(dst)
plt.subplot(122)
plt.xticks([])
plt.yticks([])
plt.imshow(I)
for i, (y_src, x_src, _, _) in enumerate(locs()):
    plt.scatter(x_src, y_src, color=cmap(i))
M = np.eye(3)
M[0,0] = 1.5
M[0,1] = .5
M[1,1] = -2
M[0,1] = 1.2

cmap = get_cmap(h*w)
locs = setup_sampling_locs(I, dst, region=[160, 230, 200, 270], M=M)
sample(I, dst, locs())
plt.figure(figsize=(15,7.5))
plt.subplot(121)
plt.xticks([])
plt.yticks([])
plt.imshow(dst)
plt.subplot(122)
plt.xticks([])
plt.yticks([])
plt.imshow(I)
for i, (y_src, x_src, _, _) in enumerate(locs()):
    plt.scatter(x_src, y_src, color=cmap(i))
Use OpenCV method imwrite to save images to files. Remember to convert the image into BGR format first, however.
Image save demonstration
#dst = cv.cvtColor(dst, cv.COLOR_RGB2BGR)
#cv.imwrite('foo.png', dst)
Bilinear filtering
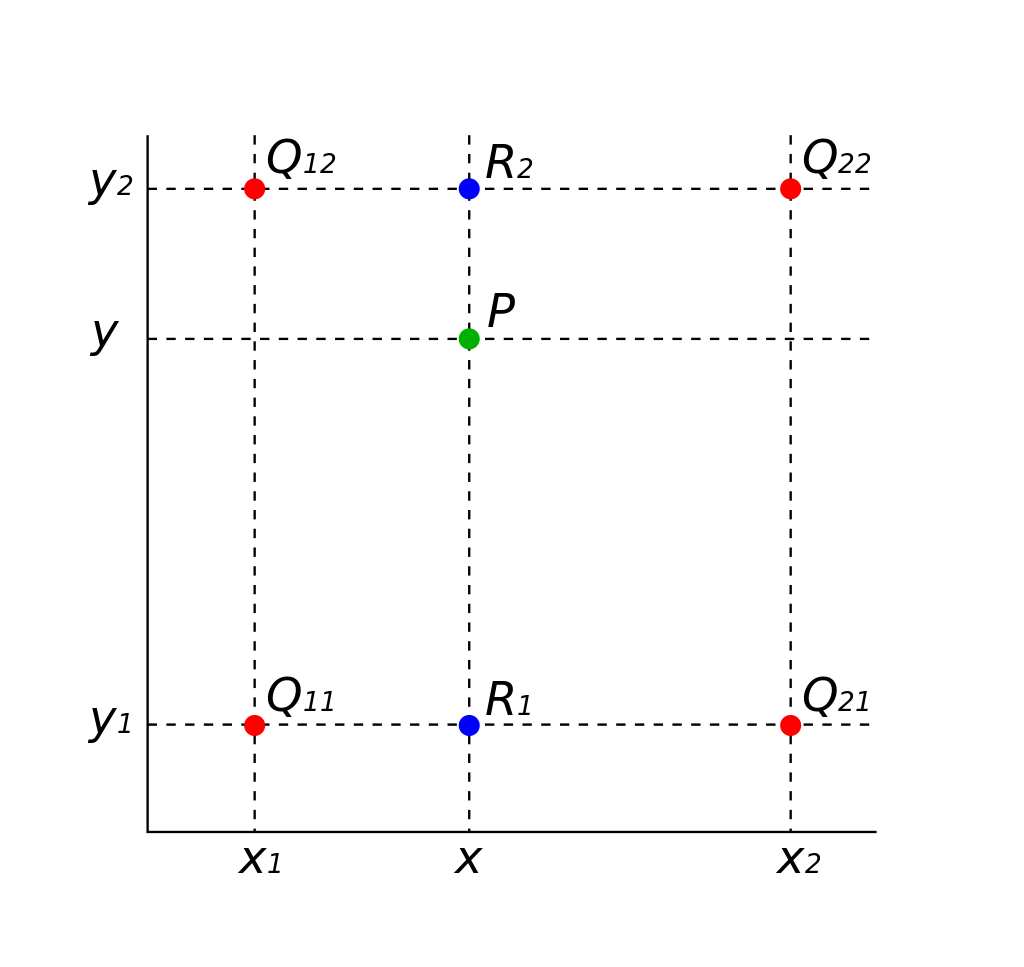
Bilinear filtering (interpolation) is an extension of linear interpolation for interpolating functions of two variables on a rectilinear 2D grid.

(Figure from Wikipedia)
Value of function $f$ at location $(x,y)$
Given value of $f$ at the following four locations:
- $(x_1,y_1) = Q_{11}$
- $(x_1,y_2) = Q_{12}$
- $(x_2,y_1) = Q_{21}$
- $(x_2,y_2) = Q_{22}$
First interpolate along $x$ direction:
$$ \begin{align} f(x,y_1) & \approx \frac{1}{(x_2 - x_1)} \left[ (x_2 - x) f(Q_{11}) + (x - x_1) f(Q_{21}) \right] \\ f(x,y_2) & \approx \frac{1}{(x_2 - x_1)} \left[ (x_2 - x) f(Q_{21}) + (x - x_1) f(Q_{22}) \right] \end{align} $$
and next interpolate along $y$.
$$ f(x,y) \approx \frac{1}{(y_2 - y_1)} \left[ (y_2 - y) f(x,y_1) + (y - y_1) f(x,y_2) \right] $$
Substituting values for $f(x,y_1)$ and $f(x,y_2)$, we get
$$ f(x,y) = \frac{1}{(x_2-x_1)(y_2-y_1)} \left[ \begin{array}{cc} x_2-x & x-x_1 \end{array} \right] \left[ \begin{array}{cc} f(Q_{11}) & f(Q_{12}) \\ f(Q_{21}) & f(Q_{22}) \end{array} \right] \left[ \begin{array}{c} y_2-y \\ y-y_1 \end{array} \right] $$
Unit square
If we choose a coordinate system in which the four points where $f$ is known are $(0, 0)$, $(1, 0)$, $(0, 1)$, and $(1, 1)$, then the interpolation formula simplifies to
$$ f(x,y) = \left[ \begin{array}{cc} 1-x & x \end{array} \right] \left[ \begin{array}{cc} f(0,0) & f(0,1) \\ f(1,0) & f(1,1) \end{array} \right] \left[ \begin{array}{c} 1-y \\ y \end{array} \right] $$
An alternate representation
For bilinear filtering, we can also write function $f$ as linear in $x$ and $y$:
$$ f(x,y) \approx a_0 + a_1 x + a_2 y + a_3 x y $$
Then all we need is to estimate the coefficients: $(a_0, a_1, a_2, a_3)$.
Exercise 1
Given value of function $f$ at locations
- $(x_1,y_1) = Q_{11}$
- $(x_1,y_2) = Q_{12}$
- $(x_2,y_1) = Q_{21}$
- $(x_2,y_2) = Q_{22}$
Devise a scheme to estimate coefficients needed for bilinear filtering.
Solution
The coefficients needed for bilinear filtering can be estimated using the following system of linear equations
$$ \left[ \begin{array}{cccc} 1 & x_1 & y_1 & x_1 y_1 \\ 1 & x_1 & y_2 & x_1 y_2 \\ 1 & x_2 & y_1 & x_2 y_1 \\ 1 & x_2 & y_2 & x_2 y_2 \end{array} \right] \left( \begin{array}{c} a_0 \\ a_1 \\ a_2 \\ a_3 \end{array} \right) = \left( \begin{array}{c} f(Q_{11})\\ f(Q_{12}) \\ f(Q_{21}) \\ f(Q_{22}) \end{array} \right) $$
(From solutions/image-sampling/solution-01.mdsolutions/image-sampling/solution-01.md)
Other options for image interpolation
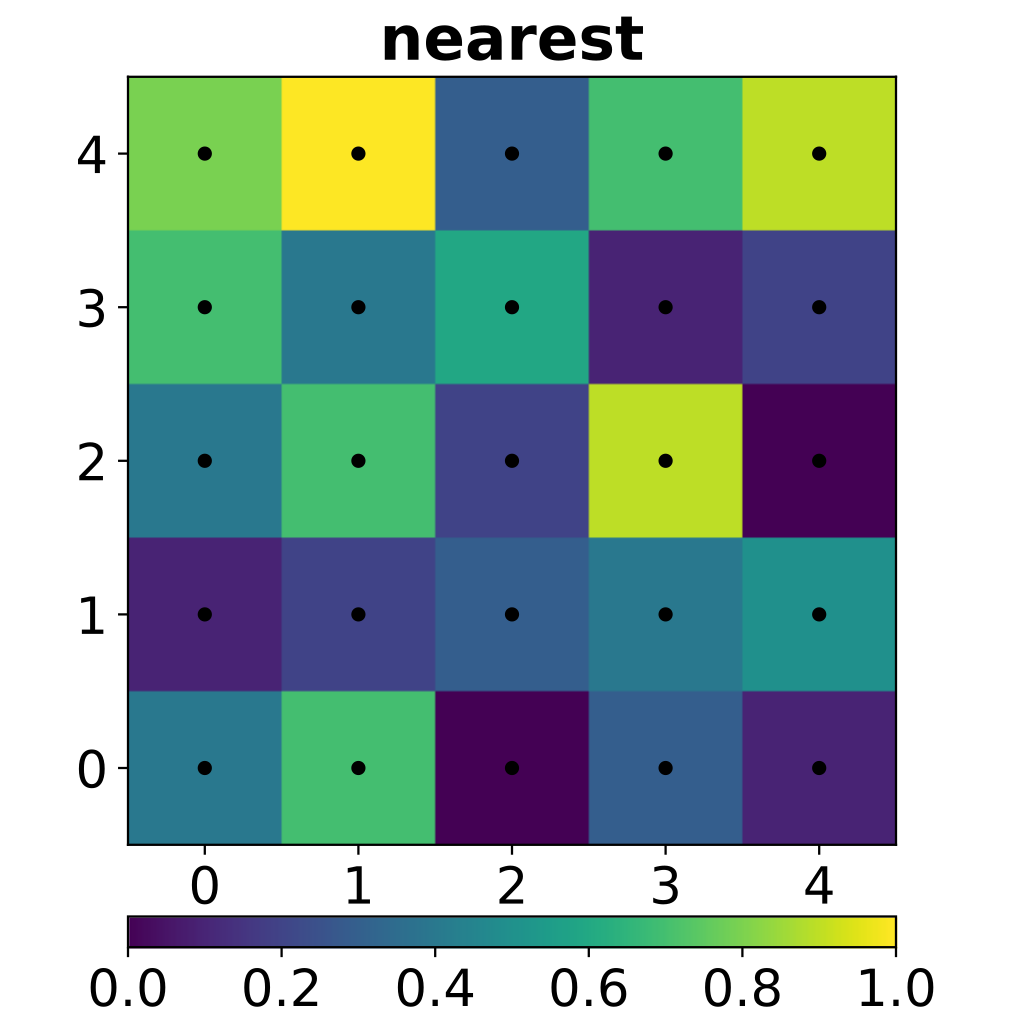
Nearest Neighbour Interpolation
Nearest neighbour interpolation on the square $[0,4] \times [0,4]$ consisting of $25$ unit squares patched together. Colour indicates function value. The black dots are the locations of the prescribed data being interpolated.

(Figure from Wikipedia)
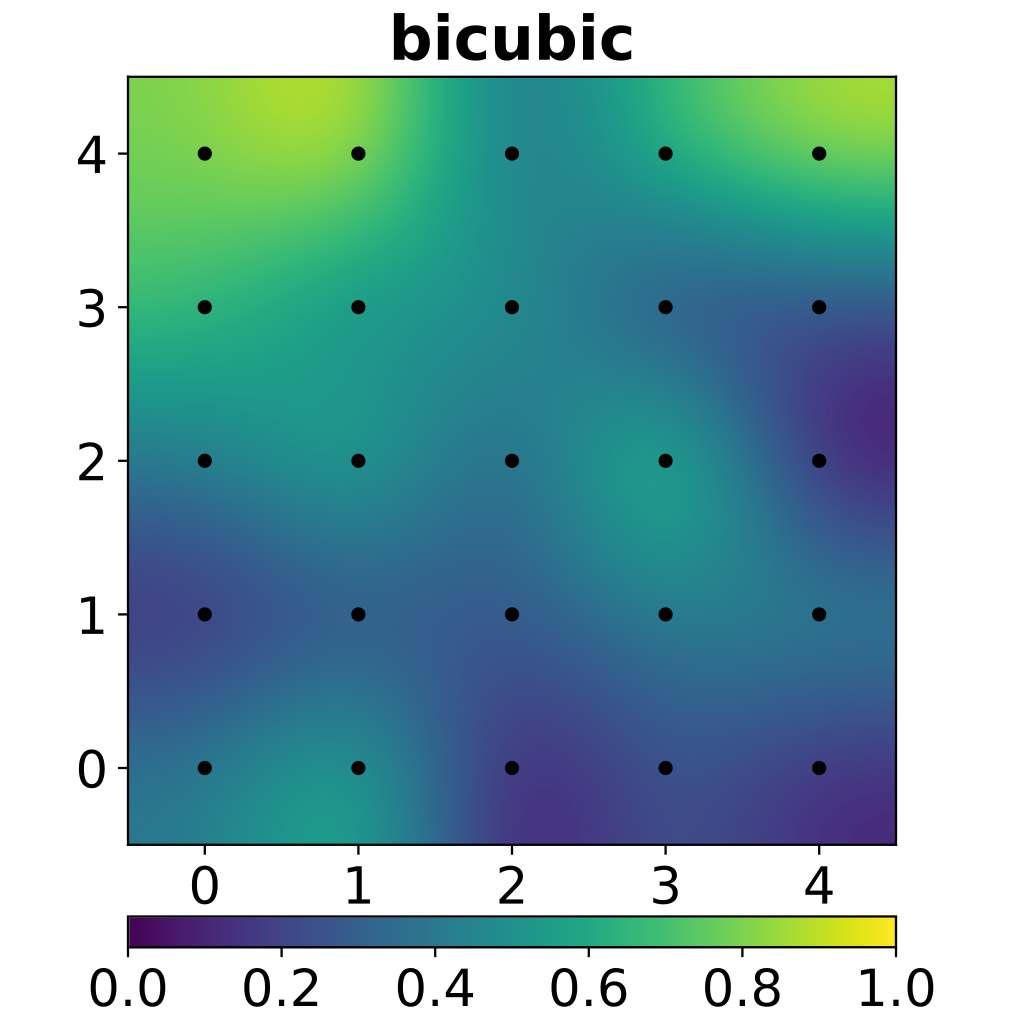
Bicubic interpolation
Bicubic interpolation on the same dataset as above. Note how the color samples are not radially symmetric.

(Figure from Wikipedia)
You can estimate the coefficients needed for bicubic interpolation by exploiting the following equation
$$ f(x,y) = \sum_{i=0}^3 \sum_{j=0}^3 a_{ij} x^i y^i $$
Hint use the alternate method discussed above.
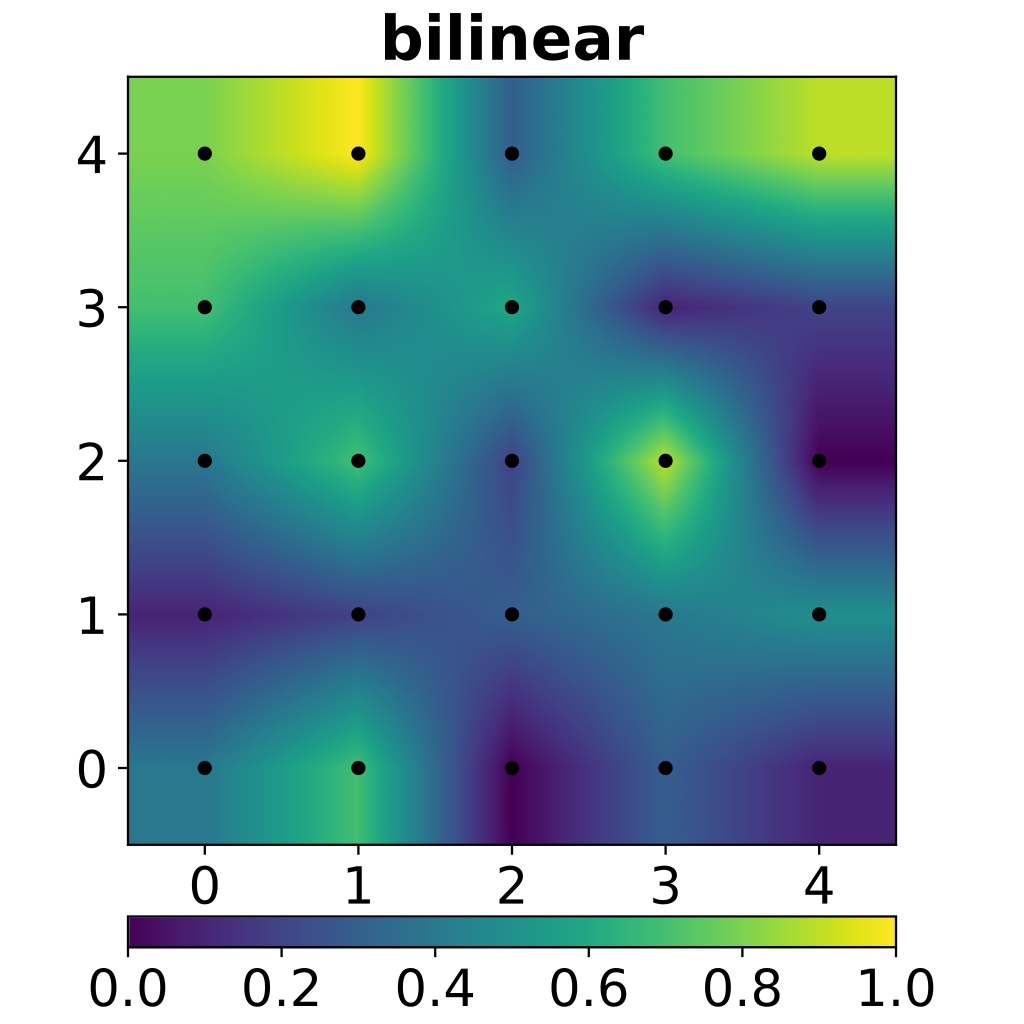
Bilinear interpolation - comparison
Bilinear interpolation on the same dataset as above. Derivatives of the surface are not continuous over the square boundaries.

(Figure from Wikipedia)
