Lab 6 (Discrete Distributions)
Simulation and Modeling (CSCI 3010U)
Faisal Z. Qureshi
Faculty of Science, Ontario Tech University
http://vclab.science.ontariotechu.ca
Check course Canvas for due date
Task 1
Sample \(100\) numbers between \(1\) and \(10\) from the distribution described
below:
- Probability of getting a \(1\) is
\(12/100\)
- Probability of getting a \(2\) is
\(13/100\)
- Probability of getting a \(3\) is
\(20/100\)
- Probability of getting a \(4\) is
\(10/100\)
- Probability of getting a \(5\) is
\(6/100\)
- Probability of getting a \(6\) is
\(4/100\)
- Probability of getting a \(7\) is
\(5/100\)
- Probability of getting a \(8\) is
\(9/100\)
- Probability of getting a \(9\) is
\(20.9/100\)
- Probability of getting a \(10\) is
\(0.1/100\)
Now complete the following tasks:
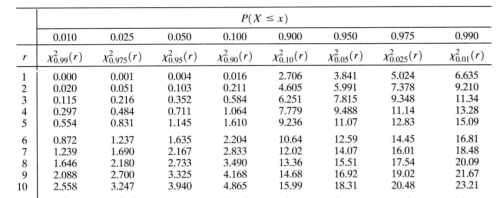
- Plot the normalized histogram
- Use Chi-square test to see if the null hypothesis stands.
Assume a significance level of \(0.05\). Figure 1 contains the Chi-square
table.
Task 2
Now repeat task 1 with a sample size of \(100,000\).
Submission
Via Canvas.
- Python file that includes your code for sampling \(100\) and \(100,000\) numbers and plotting the
normalized histogram.
- A pdf file that shows the work supporting your assertion whether or
not the null hypothesis holds for tasks 1 and 2.