Template Matching
Faisal Qureshi
Professor
Faculty of Science
Ontario Tech University
Oshawa ON Canada
http://vclab.science.ontariotechu.ca
Copyright information
© Faisal Qureshi
License

This work is licensed under a Creative Commons Attribution-NonCommercial 4.0 International License.
Lesson Plan
- Sum of squared differences
- Normalized sum of squared differences
- Cross-correlation
- Normalized cross-correlation
- Correlation coefficient
- Normalized correlation coefficient
Key insight
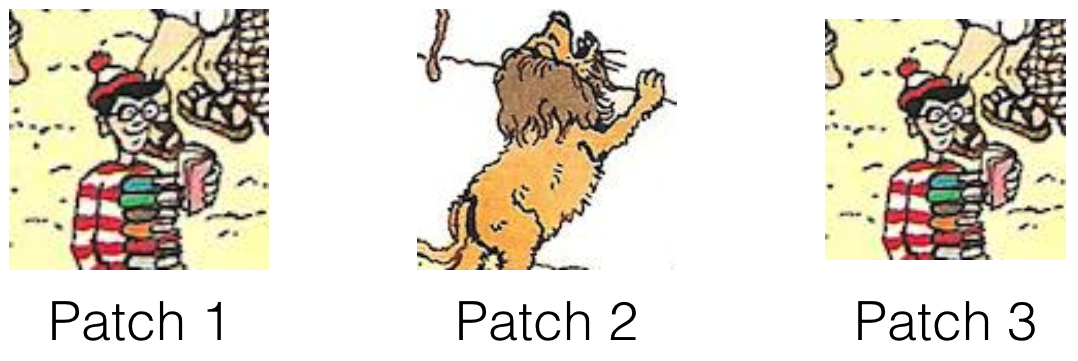
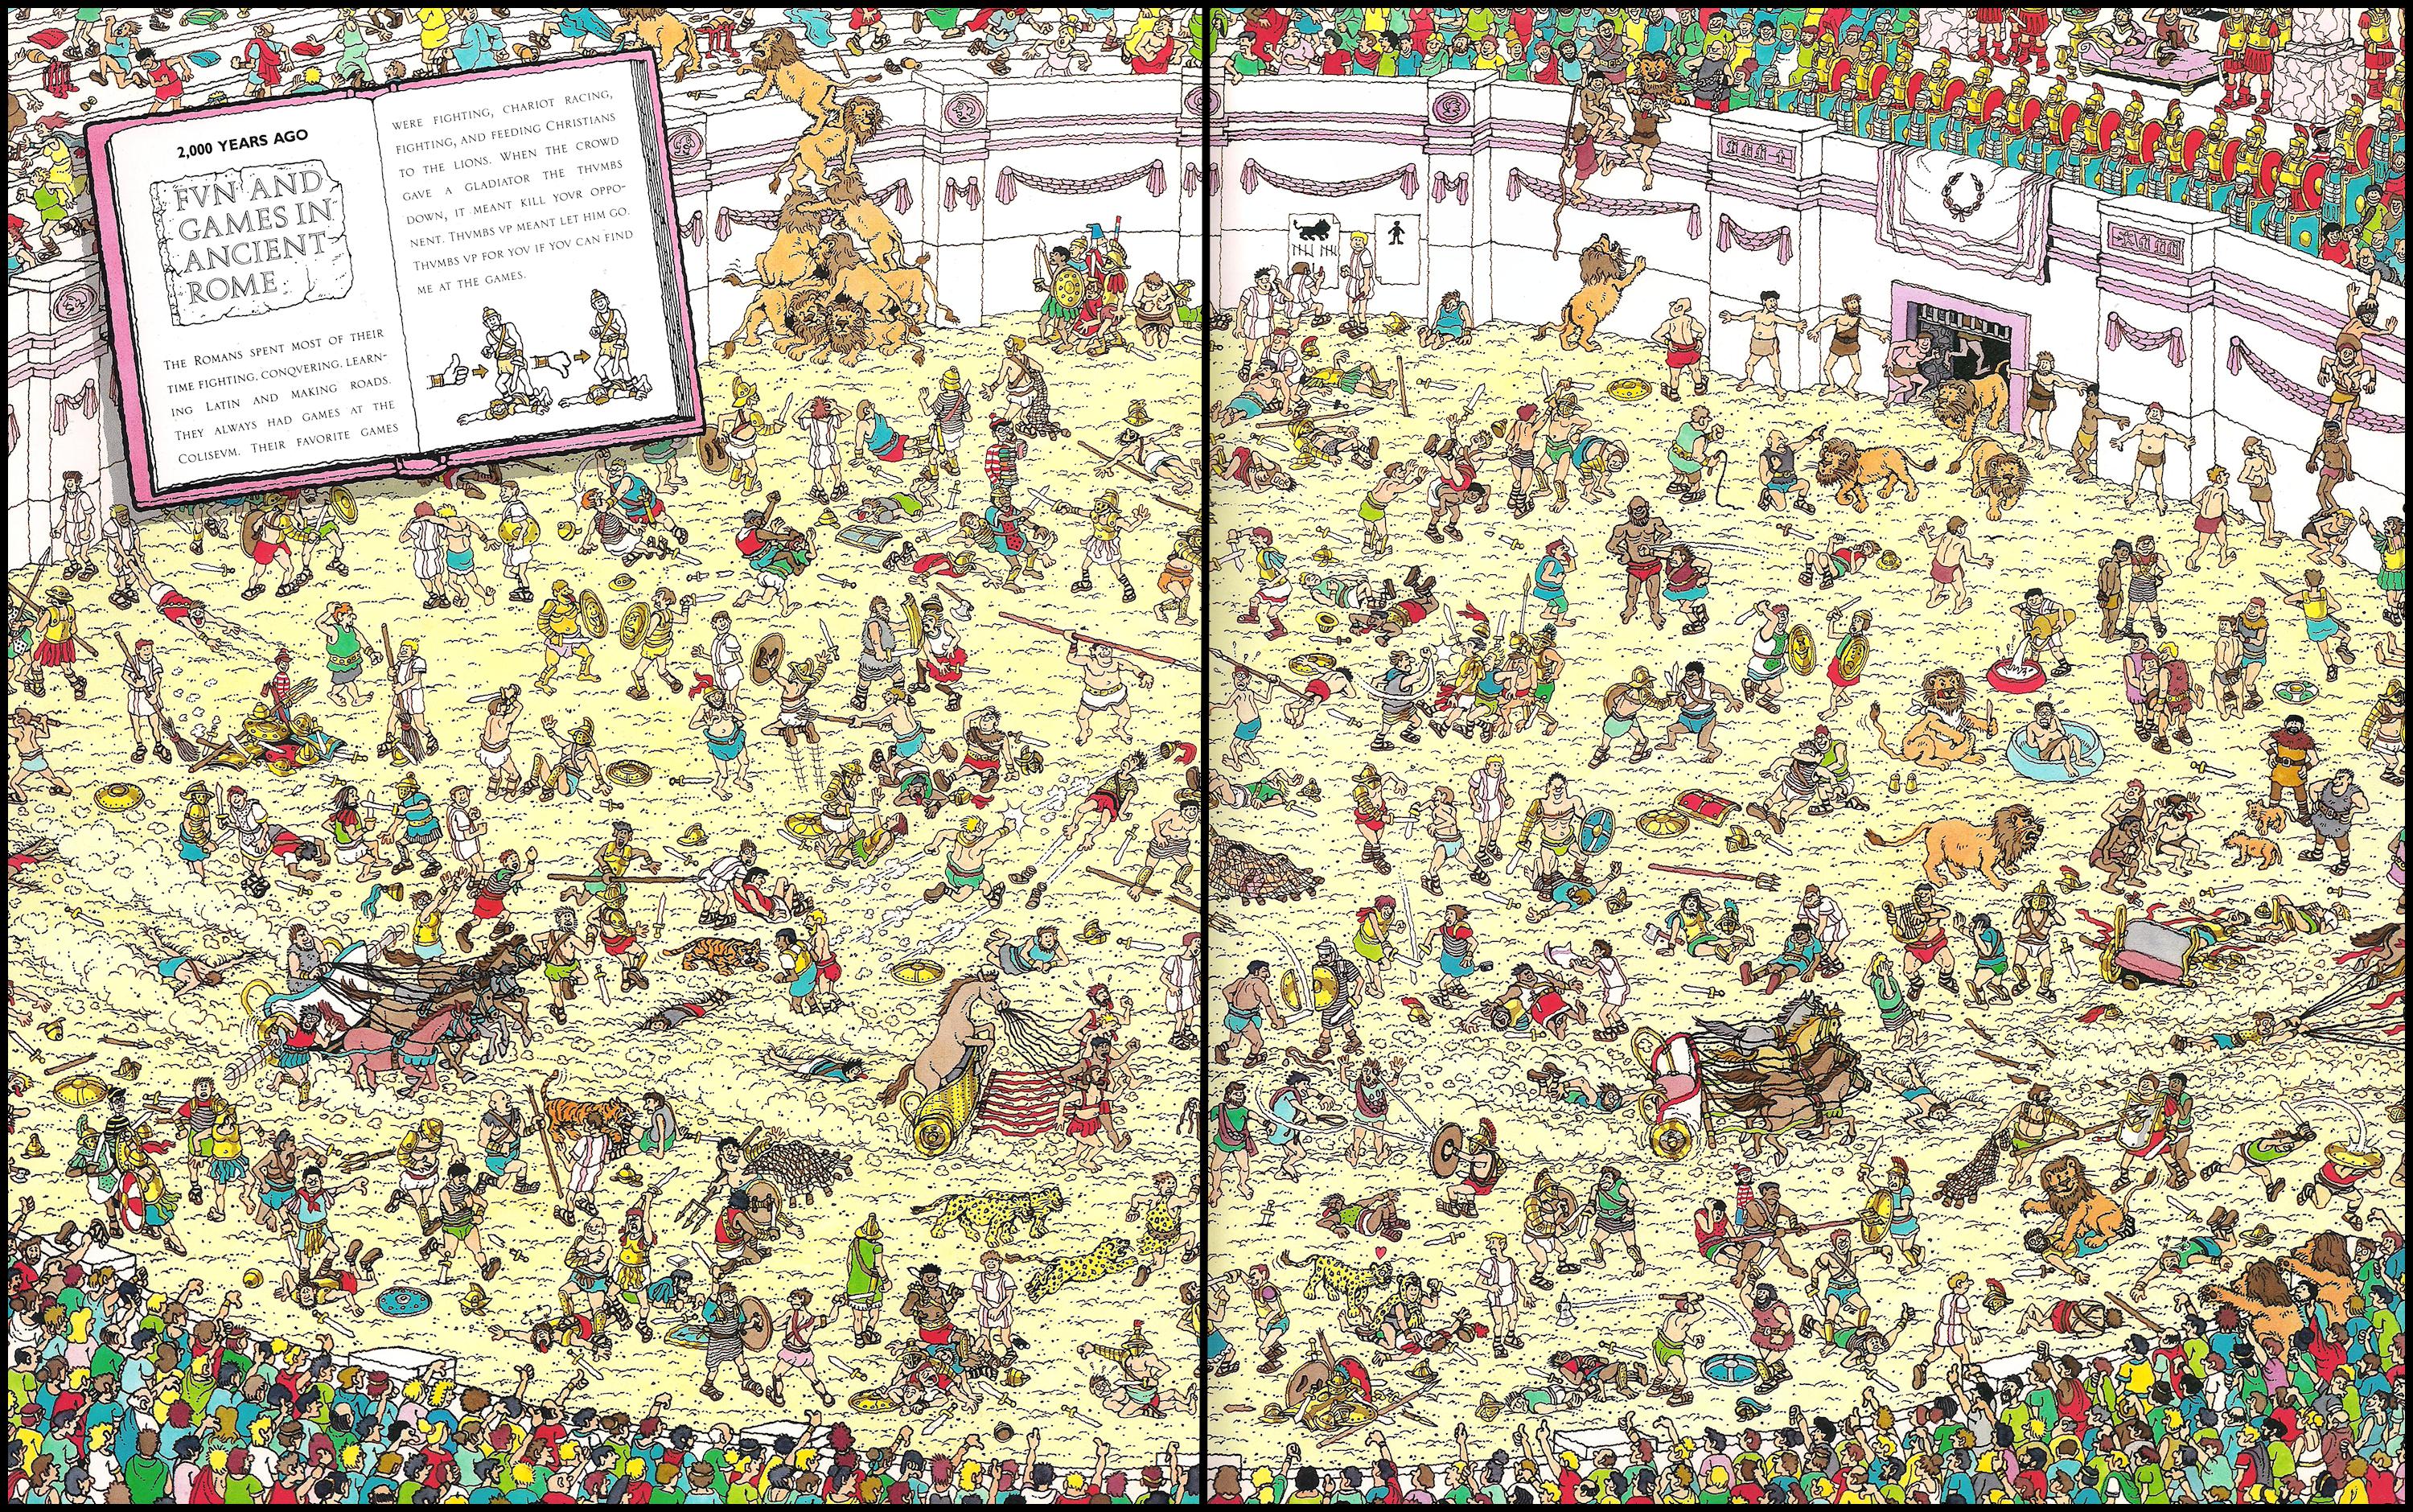
Compare patches in the image with Waldo's picture. In order to do so, we need to be able determine if patch 1 is more similar to patch 2 or patch 3 (as shown in the figure below).

Template Matching
Given a source image $I$ and a template $T$, we compare the template image against the source image by sliding it one pixel at a time (left to right, top to bottom) and computing a similarity (or alternately difference) between template and the image patch at each location. The similarity scores is computed using a suitable function $g(T, I, i, j) \mapsto R(i,j)$, where $R(i,j)$ is the similarity score for between the template and the image patch at location $(i,j)$. Location corresponding to highest (or alternately lowest) value in the result matrix $R$ represent the "match location."
A common trick is to treat both the template and patches as vectors in a high-dimensional space. Template-patch-matching problem is then reduced to finding the nearest vector (in this high-dimensional space).
Picking image patches
import cv2
import numpy as np
import scipy as sp
from scipy import signal
import matplotlib.pyplot as plt
import numpy as np
import cv2 as cv
import matplotlib.pyplot as plt
I = cv.imread('data/where-is-waldo.jpg')
I = cv.cvtColor(I, cv.COLOR_BGR2RGB)
plt.figure(figsize=(10,10))
plt.imshow(I)
<matplotlib.image.AxesImage at 0x13277b0e0>
Lets pick a patch from this image
y, x = 250, 750
half_h, half_w = 100, 200
def pick_patch(I, y, x, half_h, half_w):
return I[y-half_h:y+half_h+1, x-half_w:x+half_w+1, :]
for yi in range(3):
for xi in range(1):
x_ = x + 30 * xi
y_ = y + 30 * yi
patch = pick_patch(I, y_, x_, half_h, half_w)
fig = plt.figure(figsize=(5,5))
plt.imshow(patch)
plt.title('Patch: yx = {}, size = {}'.format((y_,x_), patch.shape[:2]))
plt.show()
template = cv.imread('data/waldo.png')
template = cv.cvtColor(template, cv.COLOR_BGR2RGB)
plt.figure(figsize=(5,5))
plt.imshow(template)
<matplotlib.image.AxesImage at 0x134ce2ad0>
template = template.flatten()
patch = pick_patch(I, 300, 400, 15, 15).flatten()
print('Template size = {}'.format(template.shape[0]))
print('Patch size = {}'.format(patch.shape[0]))
Template size = 21939 Patch size = 2883
Herein lies the problem. How do we compare two vectors of different sizes?
Observation 1: The template and the patch must have the same dimensions.
Techniques for comparing patches
We now discuss methods for comparing image patches (and templates). The following discussion assumes that patches (and templates) have the same dimensions (observation 1 above). We also use the following notation:
- Template: $T$
- Image: $I$
- Image patch centered at $(i,j)$: $I(i+k, j+l)$
- Response: $R$
Aside:
For OpenCV Template Matching function if image is $W \times H$ and template is $w \times h$ then result $R$ is $(W-w+1) \times (H-h+1)$.
def highlight(R, T, I, use_max=True):
W, H = I.shape[0], I.shape[1]
w, h = T.shape[0], T.shape[1]
wr, hg = R.shape[0], R.shape[1]
# print(W,H)
# print(w,h)
# print(wr,hg)
min_val, max_val, min_loc, max_loc = cv2.minMaxLoc(R)
loc = max_loc if use_max else min_loc
loc = loc + np.array([h//2, w//2]) # Size of R is different from I
tl = loc - np.array([h//2, w//2])
br = loc + np.array([h//2, w//2])
I_ = np.copy(I)
c = (1.0, 0, 0) if I_.dtype == 'float32' else (255, 0, 0)
# print(c)
# print(tl)
# print(br)
cv.rectangle(I_, tuple(tl), tuple(br), c, 4)
return I_
# Image
img_waldo = cv.imread('data/where-is-waldo.jpg')
img_waldo = cv.cvtColor(img_waldo, cv.COLOR_BGR2RGB)
img_waldo_zoomed = img_waldo[344:824, 1100:1440, :]
img = cv.cvtColor(img_waldo_zoomed, cv.COLOR_RGB2GRAY)
# plt.figure(figsize=(20,20))
# plt.imshow(img_waldo_zoomed)
# plt.xticks([])
# plt.yticks([])
# Template
waldo = img_waldo_zoomed[167:264,123:179,:]
template = cv.cvtColor(waldo, cv.COLOR_RGB2GRAY)
foo = np.ones(img_waldo_zoomed.shape, dtype=img_waldo_zoomed.dtype)*255
foo[0:waldo.shape[0],0:waldo.shape[1],:] = waldo
plt.figure(figsize=(15,5))
plt.subplot(131)
plt.title('Image')
plt.imshow(img_waldo_zoomed)
plt.subplot(132)
plt.title('Template')
plt.imshow(waldo)
plt.subplot(133)
plt.title('Template (Actual Size)')
plt.imshow(foo)
plt.suptitle('Image and template used for the following examples');
Sum of Squared Differences (SSD)
$$ R(i,j) = \sum_{k,l} \left( I(i+k, j+l) - T(k,l) \right)^2 $$
Here $R(i,j)$ encodes the distance between the template and image patch centered at image location $(i,j)$. The smaller this value, the more similar is template to the patch.
SSD is sensitive to average intensity.
T = template.copy()
I = img.copy()
method = 'cv2.TM_SQDIFF'
R = cv.matchTemplate(I, T, eval(method))
I_ = highlight(R, T, img_waldo_zoomed, use_max=False)
plt.figure(figsize=(10,6))
plt.subplot(121)
plt.title('Response $R(i,j)$')
plt.imshow(R, cmap = 'gray')
plt.subplot(122)
plt.imshow(I_)
plt.suptitle(method)
plt.show();
Sum of Squared Differences Normalized (SSD)
$$ R(i,j) = \frac{\sum_{k,l} \left( I(i+k, j+l) - T(k,l) \right)^2} {\sqrt{\sum_{k,l} I(i+k, j+l)^2 \sum_{k,l} T(k,l)^2}} $$
The smaller this value, the more similar is template to the patch.
T = template.copy()
I = img.copy()
method = 'cv2.TM_SQDIFF_NORMED'
R = cv.matchTemplate(I, T, eval(method))
I_ = highlight(R, T, img_waldo_zoomed, use_max=False)
plt.figure(figsize=(10,6))
plt.subplot(121)
plt.title('Response $R(i,j)$')
plt.imshow(R, cmap = 'gray')
plt.subplot(122)
plt.imshow(I_)
plt.suptitle(method)
plt.show();
Correlation Coefficient Definition
A measure of the degree to which the movement of two random variables are associated
$$ \rho_{xy} = \frac{\mathrm{cov}(x,y)}{\sigma_x \sigma_y} $$
where
$\mathrm{cov}(x,y) = \mathrm{E}[(x - \mu_x)(y - \mu_x)] $ is covariance of random variables $x$ and $y$, and $\mu_x$, $\mu_y$, $\sigma_x$ and $\sigma_y$ are, respectively, their means and standard deviations.
Correlation Coefficient
$$ R(i,j) = \sum_{k,l} I'(i+k, j+l) T'(k, l) $$
where
$$ \begin{align} I' &= I - \frac{1}{wh} \sum_{k',l'} I(i+k',j+l') \\ T' &= T - \frac{1}{wh} \sum_{k',l'} T(k',l') \end{align} $$
$w$ and $h$ refer to the width and height of template $T$.
T = template.copy()
I = img.copy()
method = 'cv2.TM_CCOEFF'
R = cv.matchTemplate(I, T, eval(method))
I_ = highlight(R, T, img_waldo_zoomed, use_max=True)
plt.figure(figsize=(10,6))
plt.subplot(121)
plt.title('Response $R(i,j)$')
plt.imshow(R, cmap = 'gray')
plt.subplot(122)
plt.imshow(I_)
plt.suptitle(method)
plt.show();
Correlation Coefficient Normalized
$$ R(i,j) = \frac{\sum_{k,l} I'(i+k, j+l) T'(k, l)} {\sqrt{\sum_{k,l}I'(i+k, j+l)^2 \sum_{k,l} T'(k,l)^2}} $$
where
$$ \begin{align} I' &= I - \frac{1}{wh} \sum_{k',l'} I(i+k',j+l') \\ T' &= T - \frac{1}{wh} \sum_{k',l'} T(k',l') \end{align} $$
$w$ and $h$ refer to the width and height of template $T$.
Invariant to mean and scale of intensity.
T = template.copy()
I = img.copy()
method = 'cv2.TM_CCOEFF_NORMED'
R = cv.matchTemplate(I, T, eval(method))
I_ = highlight(R, T, img_waldo_zoomed, use_max=True)
plt.figure(figsize=(10,6))
plt.subplot(121)
plt.title('Response $R(i,j)$')
plt.imshow(R, cmap = 'gray')
plt.subplot(122)
plt.imshow(I_)
plt.suptitle(method)
plt.show();
Cross-Correlation
$$ R(i,j) = \sum_{k,l} I(i+k, j+l) T(k, l) $$
Response is stronger for higher intensities, which leads to false positive. Recall that cross-correlation can be implemented as linear filtering.
T = template.copy()
I = img.copy()
method = 'cv2.TM_CCORR'
R = cv.matchTemplate(I, T, eval(method))
I_ = highlight(R, T, img_waldo_zoomed, use_max=True)
plt.figure(figsize=(10,6))
plt.subplot(121)
plt.title('Response $R(i,j)$')
plt.imshow(R, cmap = 'gray')
plt.subplot(122)
plt.imshow(I_)
plt.suptitle(method)
plt.show();
Normalized Cross Correlation
$$ R(i,j) = \frac{\sum_{k,l} I(i+k, j+l) T(k, l)} {\sqrt{\sum_{k,l} I(i+k, j+l)^2 \sum_{k,l} T(k, l)^2}} $$
T = template.copy()
I = img.copy()
method = 'cv2.TM_CCORR_NORMED'
R = cv.matchTemplate(I, T, eval(method))
I_ = highlight(R, T, img_waldo_zoomed, use_max=True)
plt.figure(figsize=(10,6))
plt.subplot(121)
plt.title('Response $R(i,j)$')
plt.imshow(R, cmap = 'gray')
plt.subplot(122)
plt.imshow(I_)
plt.suptitle(method)
plt.show();
Scale considerations
Thus far, we have assumed that template is the same size (i.e., similar scale) as the target object in the image. Notice that "waldo" template has the same size (i.e., height and width) as the size of "waldo" seen in the image. What would happen if the we relax this assumption?
# Image
scale = 4
img_waldo = cv.imread('data/where-is-waldo.jpg')
img_waldo = cv.cvtColor(img_waldo, cv.COLOR_BGR2RGB)
img_waldo_zoomed = img_waldo[344:824, 1100:1440, :]
H, W = img_waldo_zoomed.shape[0], img_waldo_zoomed.shape[1]
img_waldo_resized = cv.resize(img_waldo_zoomed, (int(W*scale),int(H*scale)))
img = cv.cvtColor(img_waldo_resized, cv.COLOR_RGB2GRAY)
# Template
waldo = img_waldo_zoomed[167:264,123:179,:]
template = cv.cvtColor(waldo, cv.COLOR_RGB2GRAY)
foo = np.ones(img_waldo_resized.shape, dtype=img_waldo_resized.dtype)*255
foo[0:waldo.shape[0],0:waldo.shape[1],:] = waldo
plt.figure(figsize=(15,5))
plt.subplot(131)
plt.title('Image')
plt.imshow(img_waldo_resized)
plt.subplot(132)
plt.title('Template')
plt.imshow(waldo)
plt.subplot(133)
plt.title('Template (Actual Size)')
plt.imshow(foo)
plt.suptitle('Image and template used for the following examples')
Text(0.5, 0.98, 'Image and template used for the following examples')
Lets perform template matching to find waldo.
T = template.copy()
I = img.copy()
methods = ['cv2.TM_CCOEFF',
'cv2.TM_CCOEFF_NORMED',
'cv2.TM_CCORR',
'cv2.TM_CCORR_NORMED',
'cv2.TM_SQDIFF',
'cv2.TM_SQDIFF_NORMED']
method = methods[4]
R = cv.matchTemplate(I, T, eval(method))
I_ = highlight(R, T, img_waldo_resized, use_max=True)
plt.figure(figsize=(10,6))
plt.subplot(121)
plt.title('Response $R(i,j)$')
plt.imshow(R, cmap = 'gray')
plt.subplot(122)
plt.imshow(I_)
plt.suptitle(method)
plt.show();
Observation 2: Template matching is not scale invariant.
We need to perform scale space analysis for template matching. In other words, we need to use image pyramids: construct an image pyramid, perform template matching at each scale, find the correct scale and location within that scale using maxima (minima) search.
Other Considerations
Is template matching rotation invariant? What about occlusions? What about shifts in color?


